Take the Path to Success with an Energy Market Report like No Other
Don’t let fragmented and inconsistent data sources get in the way of your ability to see the big picture and anticipate market shifts. Our new consolidated energy dashboard revolutionizes how you track and analyze the entire energy landscape.
Get fast, easy, actionable macro and micro views into the entire oil and gas value chain.
Energy Path™ Is a First-Of-Its-Kind Energy Market Reporting Software That Tracks Oil and Gas across Every Step of the Energy Value Chain from Wellhead to Demand
Powered by East Daley Analytics’ Energy Data Studio®, Energy Path seamlessly tracks every molecule of oil and gas commodities across the entire value chain, from upstream to midstream to downstream, with a single easy-to-read, easy-to-use energy market dashboard.

Optimizes production and transportation strategies

Identifies bottlenecks and improves operational efficiency

Keeps you ahead of market shifts—and the competition
You’ve Never Seen the Oil and Gas Value Chain the Way You’ll See It with Energy Path™
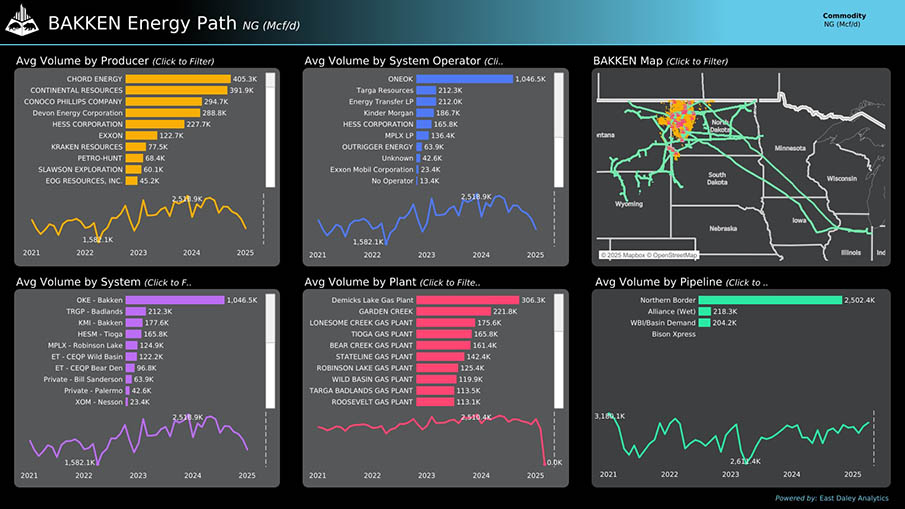
With Energy Path™ at your fingertips, just one energy industry reporting software product is enough. View volumes and rates for natural gas, NGLs, and crude oil all on one dashboard and track from wellhead to demand with real-time data sourced from East Daley’s comprehensive proprietary datasets and a revolutionary, user-friendly mapping system that connects wells, pipelines, plants, and more.
Faster Updates and Decision-Making
Rapidly capture and process market changes. Energy Path is fed by East Daley’s most up-to-date proprietary datasets to keep your strategies up-to-date.
Simpler Dashboards, Clearer Insights
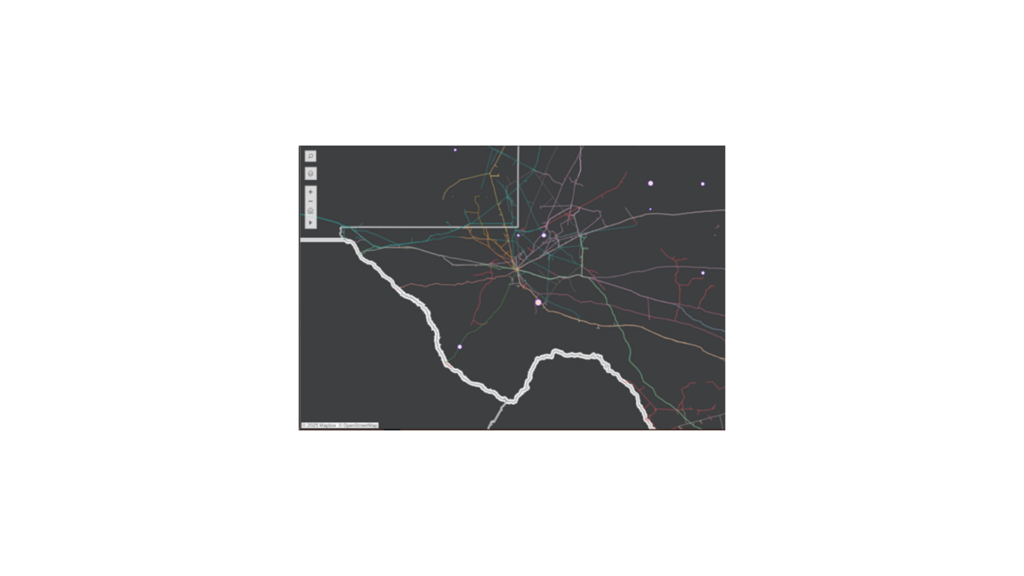
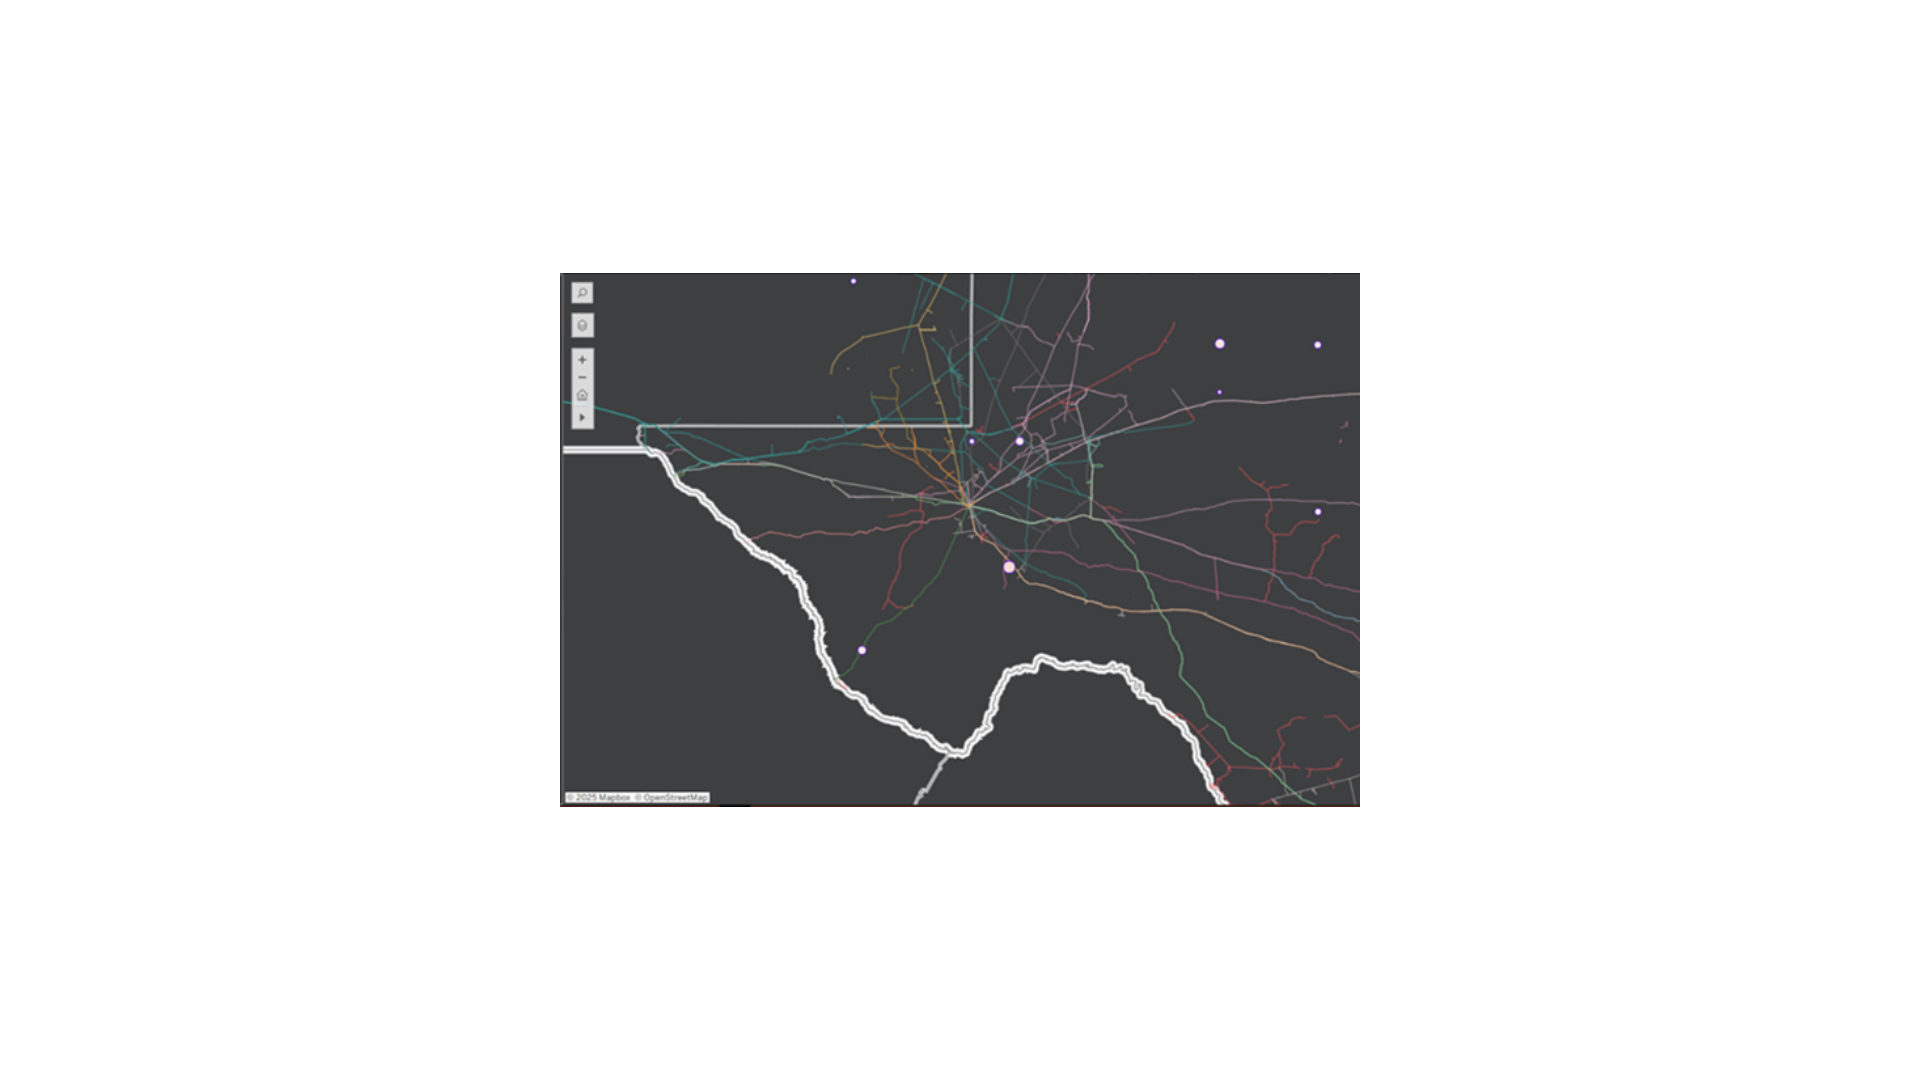
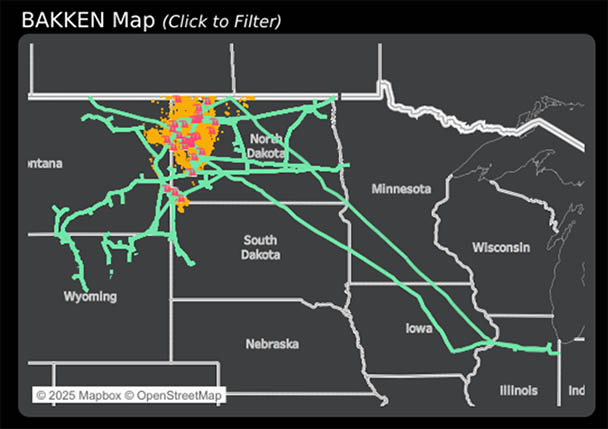
It’s easy to see how and where energy commodities are moving with revolutionary mapping that connects the entire value chain together.
Actionable Intelligence for Everyone
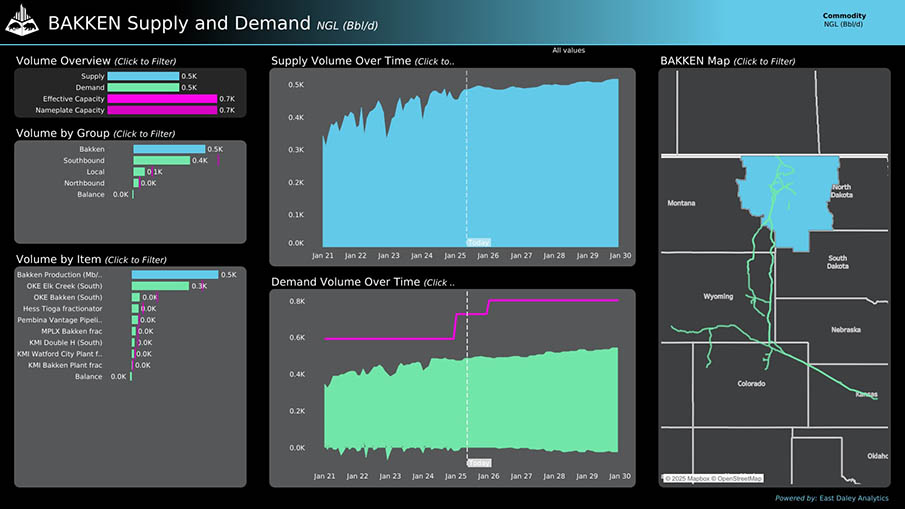
Whether you’re a producer, a midstream operator, or a downstream stakeholder, Energy Path provides the insight you need to make confident decisions quickly.

Rigs
-
Weekly rig counts at the basin, sub-basin, and midstream system level
-
Rig operator detail
-
Breakdown between public and private systems

Production
-
Historical production data from the wellhead
-
Producer level historical production view
-
Production allocated to each basin down to each county

Gathering and Processing
-
View plant and gathering system utilization
-
See where plant expansion is needed before it’s announced
-
Allocate production to midstream G&P

Transport
-
Access flow data correlated to each G&P system
-
View constrained pipelines
-
Visualize contracted capacity across pipelines by shipper

Demand
-
View forecasted storage levels
-
Get expectations on the next waves of LNG buildout
-
Forecast demand across energy, industrial, residential, and commercial sectors
MARKET STUDY
Energy Path Case Study
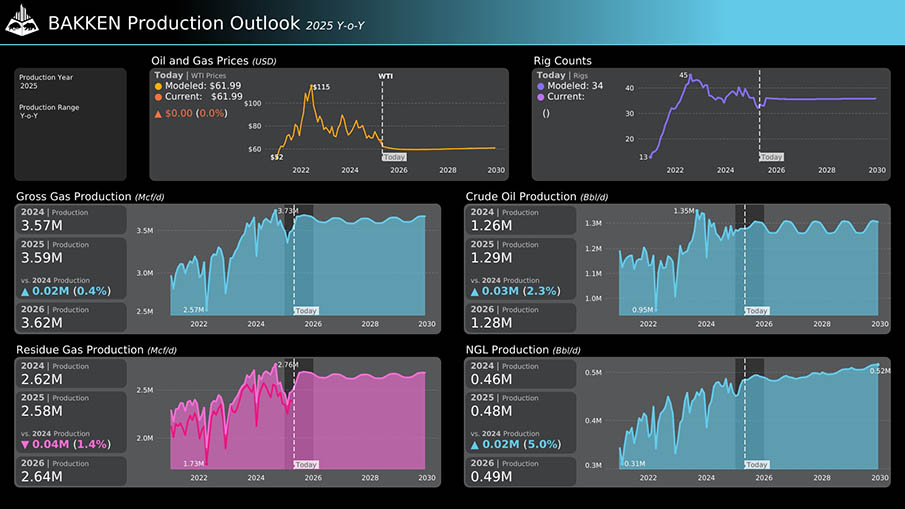
Full Energy Supply Chain Transparency in the Bakken Basin
Make smarter, faster energy decisions an easy-to-use dashboard that takes you on the journey of every molecule of oil, gas, and NGL from start to finish with real-time visibility. Read our latest case study and see how the Energy Path dashboard provides fast, easy visibility into the production data for operators like Chord Energy in the Bakken Shale region, empowering you to optimize operations, forecast production with confidence, and identify opportunities before the competition.

Discover the Difference a Better Energy Market Dashboard Makes
Energy Path gives you a comprehensive, consolidated energy dashboard that shows you more than any other product on the market—and makes the data at your fingertips easy to understand and use to inform your strategic decision-making.
Comprehensive, Multi-Commodity Coverage
Unlike competing products that focus on a single commodity, our energy industry reporting software provides a full-spectrum market perspective to help you identify correlations, optimize trading strategies, and make more informed decisions across the entire hydrocarbon value chain.
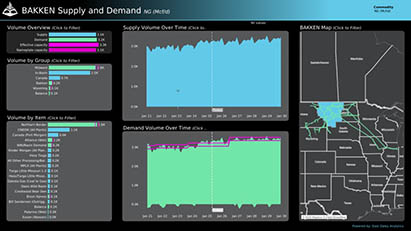
Granular Energy Data Visualization
When just a high-level overview isn’t enough, Energy Path™ goes deep. Track volumes and rates at every stage with unmatched detail so you can pinpoint bottlenecks, forecast price movements, and assess infrastructure constraints with real-time, location-specific oil and gas commodity intelligence.

Data-Driven Market Intelligence, Not Just Raw Data
Go beyond the basic data feeds offered by other energy market reports. With advanced analytics and actionable insights, Energy Path™ gives you the context you need to use the data to its full potential. Anticipate market shifts, mitigate risks, and capitalize on emerging opportunities like never before.


