Executive Summary: Rigs: The total US rig count decreased by 6 rigs for the June 2 week, down to 558 from 564. Infrastructure: The Permian Basin is on par to grow ~8.3% 2024-2025 exit-to-exit despite rig count decreasing 11 (3.5%). Storage: East Daley expects a withdrawal of 1.37 MMbbl in commercial and Strategic Petroleum Reserve (SPR) inventories for the week ending June 14.
Rigs:
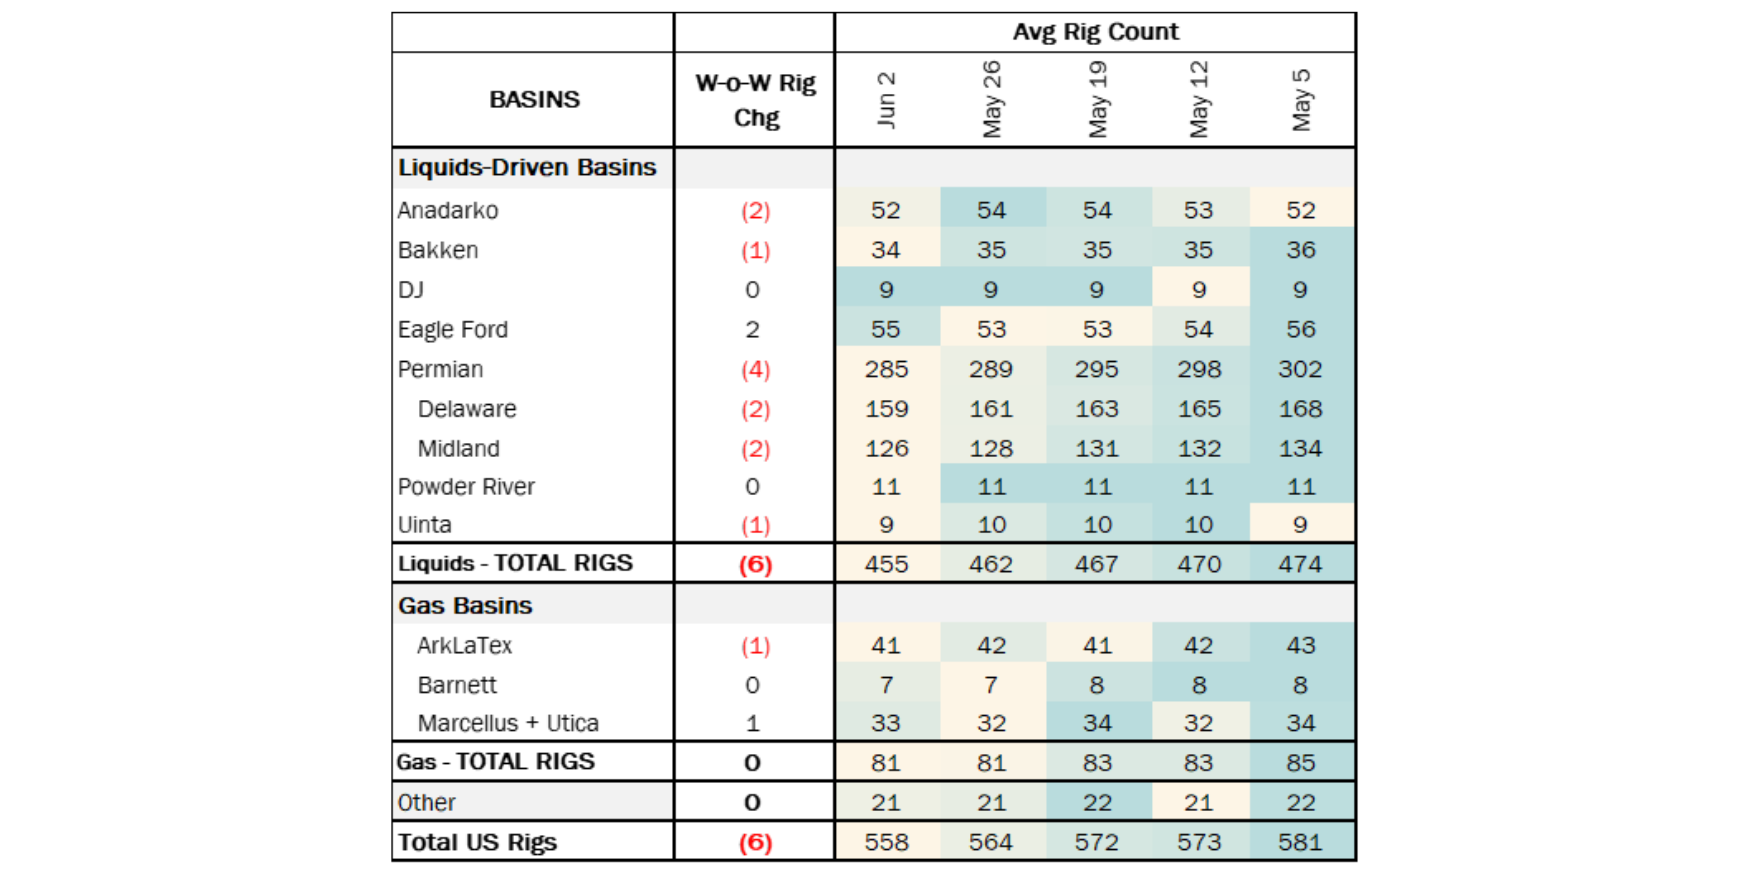
The total US rig count decreased by 6 rigs for the June 2 week, down to 558 from 564. Liquids-driven basins drove the decline, down 7 rigs W-o-W to a total of 455. The Permian decreased 4 rigs W-o-W, losing 2 in the Delaware and the Midland. The Eagle Ford gained 2 rigs and the Anadarko lost 2 W-o-W.

In the Delaware, operators EOG Resources and Conoco Phillips each subtracted 1 rig from their systems. Exxon and Endeavor Energy operating in the Midland each removed 1 rig from their systems. Eagle Ford operators EOG Resources and CML Exploration both added 1 rig W-o-W.
Infrastructure:
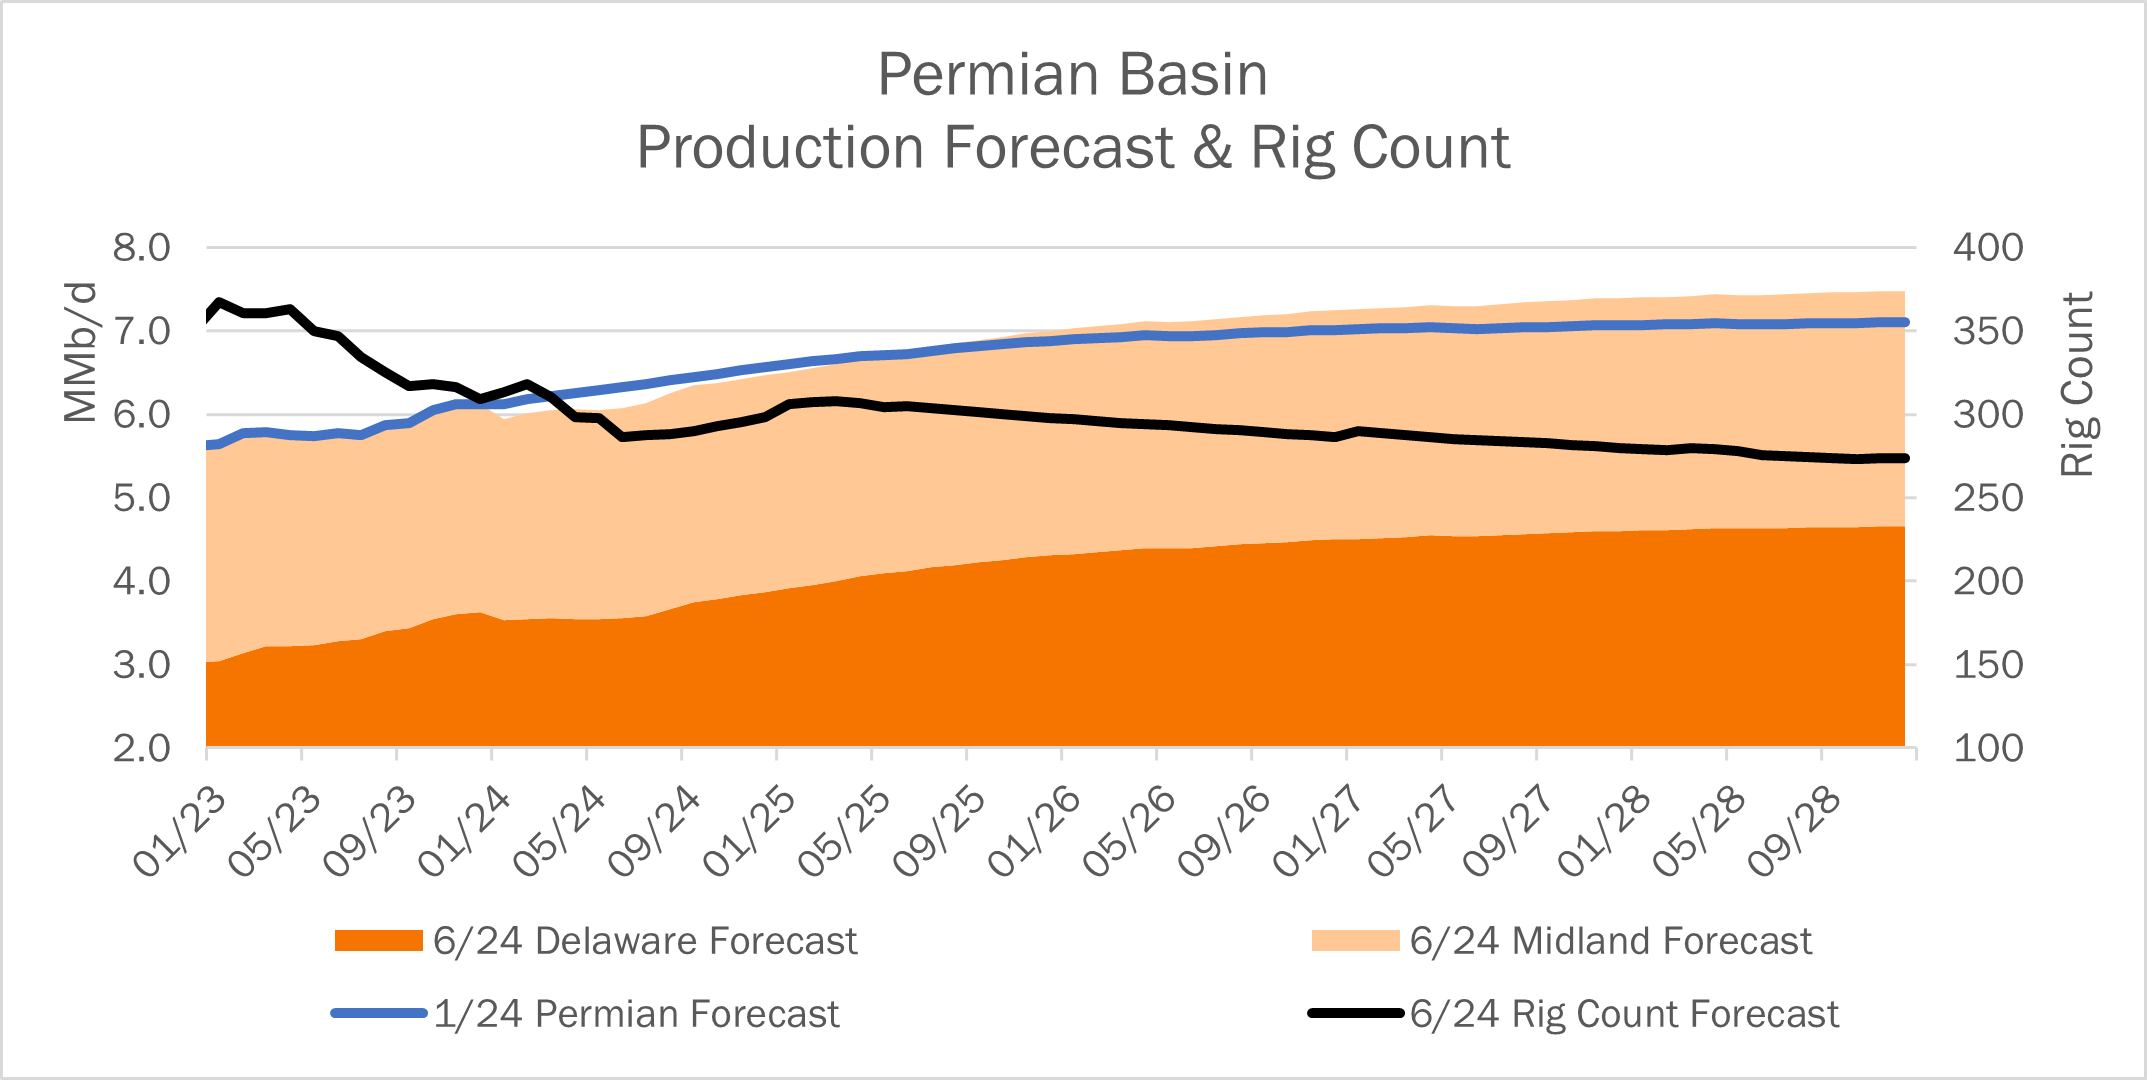
The Permian Basin is on par to grow ~8.3% 2024-2025 exit-to-exit despite rig count decreasing 11 (3.5%). East Daley’s Production Scenario Tool shows Permian production increasing to 7.5 MMb/d by YE28 with a ~7.8% reduction in rig count. East Daley believes the Permian Basin will drop another 10 rigs by YE26 before leveling off at ~280 rigs. At an average rig count of 292 throughout 2024, the Permian is on par to grow 537 Mb/d exit-to-exit.
The extensive M&A activity throughout 2023 was responsible for most of the rig reductions in 2023 as drilling programs were combined and many companies dropped rigs to stay within corporate guidance. Throughout 2024, rig counts have been tempered by gas egress constraints. As Matterhorn Pipeline comes online in July 2024 and ramps up to full capacity through September 2024, rig counts will increase. However, not to previous levels as gas egress constraints may be felt again in 2026 or early 2027.

In 2024 and going forward, we are seeing a different growth pattern in the Permian. Production growth will be realized at a slower, more consistent rate. Growth rates step down from 8% in 2024-2025 to 2-4% after 2025, significantly lower than the 13%-40% annual growth rates seen from 2015 – 2023 (excluding production impacted during COVID-19).
We believe this is a result of high oil pipeline egress utilization and the resulting change from private equity backed producers to fully integrated majors due to the M&A activity. Private equity’s style of fast growth is being replaced by a very deliberate consistent growth strategy of the majors. Diamond Back’s acquisition of Endeavor will alter Endeavor’s historic ~10% growth rate to fit Diamond Back’s 3.4% estimated growth rate.
Not to be discounted, the Permian Basin oil pipeline utilization rates may have the biggest impact on rig count and growth levels. As pipeline utilization rates exceed 85% in 2025 to Corpus Christi, Houston and Nederland destinations East Daley believes growth will be tempered until additional infrastructure is put in place. With four offshore projects currently in the works we believe the demand will be there to support additional pipeline infrastructure, which in turn will help drive production growth.
Storage:
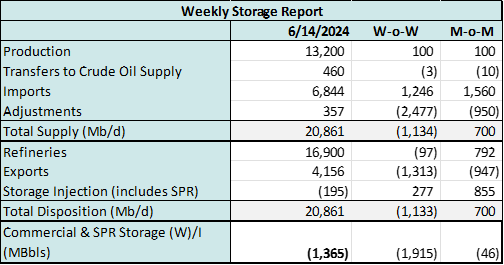
East Daley expects a withdrawal of 1.37 MMbbl in commercial and Strategic Petroleum Reserve (SPR) inventories for the week ending June 14. We expect total US stocks, including the SPR, will close at 828 MMbbl.

The US natural gas pipeline sample, a proxy for change in oil production, decreased ~0.21% W-o-W across all liquids-focused basins. Samples decreased 1.75% in the Gulf of Mexico and 0.62% in the Williston Basin. The decreases were offset by a 4.07% increase in the Eagle Ford and a 0.94% increase in the Permian. The Williston Basin and Gulf of Mexico have a high correlation between gas volumes and crude oil volumes, whereas the Permian Basin and Eagle Ford basins’ correlation is less than 45%. We expect weekly US crude oil production to remain flat at 13.2 MMb/d.
According to US bill of lading data, US crude imports decreased by 1.46 MMb/d W-o-W to 6.84 MMb/d. More than 60% of the supply originated from Canadian pipelines into the US, with the remainder largely coming from ships carrying crude from Mexico, Venezuela and Argentina.
As of June 14, there was ~423 Mb/d of refining capacity offline, including downtime for planned and unplanned maintenance. EDA expects gross crude inputs into refineries to decrease by ~147 Mb/d W-o-W, coming in at 16.9 MMb/d.

Vessel traffic monitored by EDA along the Gulf Coast decreased W-o-W. There were 23 vessels loaded for the week ending June 14 and 24 the prior week. EDA expects US exports to be 4.16 MMb/d. The SPR awarded contracts for 2.95 MMbbl to be delivered in June 2024. The SPR has 370 MMbbl in storage as of June 14, 2024.
Regulatory and Tariffs:
Presented by ARBO
Tariffs:
Enbridge Pipelines (FSP) L.L.C. Joint rates were increased and a surcharge was implemented to recover the costs imposed by the Minnesota Public Utilities Commission to decommission the Line 3 Replacement Pipeline effective July 1, 2024 FERC No 3.43.0 IS24- 598, filed May 31, 2024)
Express Pipeline LLC New international joint rates were established for the 2024 Open Season pursuant to the TSAs. Existing rates were increased by 3% pursuant to the signed TSAs effective July 1, 2024. 2024 FERC No 167.25.0 IS24- 593, filed May 31, 2024)
The above information is provided by ARBO’s Oil Pipeline Tariff Monitor. For more information on regulatory proceedings or tariff rates, please contact please contact Corey Brill via email at [email protected] or phone at 202-505-5296. https://www.goarbo.com/


