Executive Summary: Infrastructure: Energy Transfer’s (ET) 250 Mb/d Flexport expansion at its Nederland terminal is nearing startup. Rigs: The total US rig count decreased by 11 during the week of April 27 to 548. Liquids-driven basins decreased by 7 W-o-W from 452 to 445. Flows: For the week ending May 15, US natural gas volumes averaged 68.7 Bcf/d in pipeline samples, marking a W-o-W decline from 68.9 Bcf/d the previous week. Calendar: Purity Product Forecast & NGL Tabs – 5/23
Infrastructure:
Energy Transfer’s (ET) 250 Mb/d Flexport expansion at its Nederland terminal is nearing startup. Ethane service is expected later this month, propane in July, and ethylene by the end of the year, ET said on its 1Q25 earnings call.
ET confirmed the project between Beaumont and Port Arthur is over 90% contracted on 3- to 5-year terms beginning January 2026. Despite recent tariff noise, management struck a confident tone, noting strong international demand and continued spot ethane sales to China. Flexport is clearly commercially de-risked - but how will it be supplied?
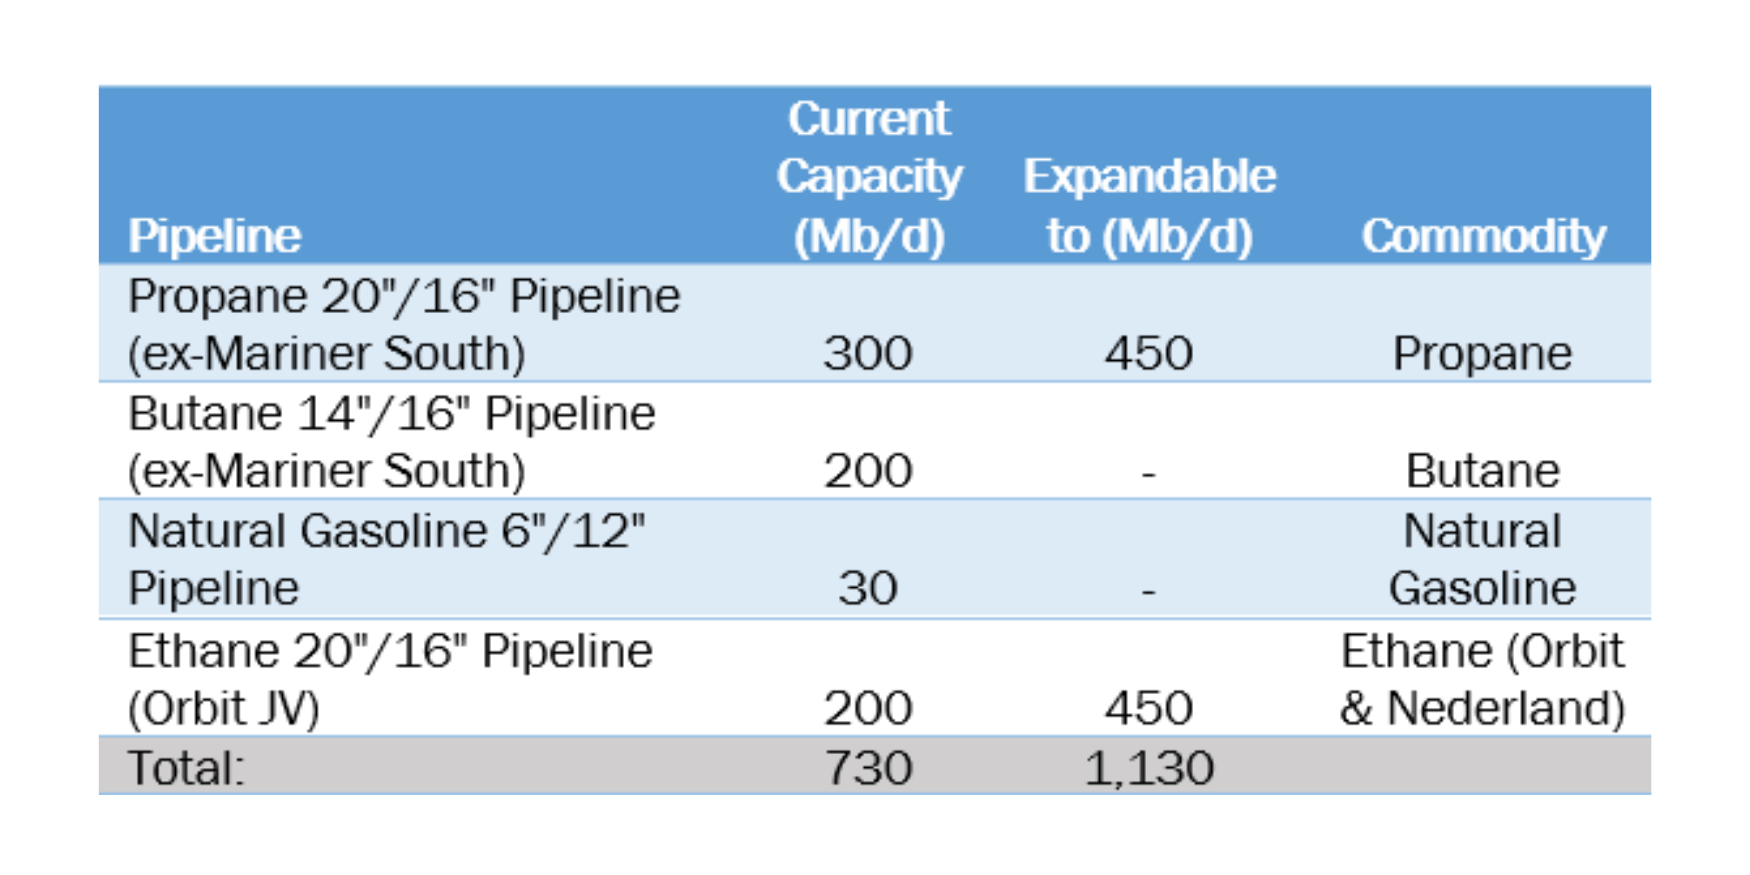
The Nederland terminal is fed by four pipelines from Mont Belvieu. Here's how each stacks up:

The challenge lies in the ethane line. The Orbit export terminal uses ~180 Mb/d of the 200 Mb/d capacity, leaving only ~20 Mb/d available for Nederland - unless ET has expanded that line.
- Net inbound capacity usable by Nederland:
730 Mb/d total – 180 Mb/d (Orbit ethane) = ~550 Mb/d
East Daley models Nederland current export capacity at 500 Mb/d. The Flexport expansion raises capacity to 750 Mb/d. This leaves Nederland ~200 Mb/d short of fully supplying the terminal post-Flexport. The shortfall is especially acute for ethane, which appears to have only ~20 Mb/d of spare capacity unless Energy Transfer expanded the line.
Given the scale of the Flexport expansion and the tight balance on inbound capacity, it’s likely that ET has quietly expanded both the ethane and propane pipelines to support the increased volumes. While no formal announcements have been made, the project’s commercial commitments and near-term in-service dates suggest that infrastructure upgrades are either complete or well underway behind the scenes.
Rigs:
The total US rig count decreased by 11 during the week of April 27 to 548. Liquids-driven basins decreased by 7 W-o-W from 452 to 445.
- Permian-Midland (-4): ConocoPhillips, Diamondback Energy, Medders Oil Co., FourPoint Energy, LLC
- Bakken (-2): ConocoPhillips, Silver Hill Energy
- Eagle Ford (-1): SM Energy

Flows: For the week ending May 15, US natural gas volumes averaged 68.7 Bcf/d in pipeline samples, marking a W-o-W decline from 68.9 Bcf/d the previous week.
Liquids-driven basins declined 0.3 Bcf/d to 17.3 Bcf/d, recording a W-o-W decrease. The Permian Basin declined 3% W-o-W averaging 5.8 Bcf/d, similar to the Anadarko Basin sample which declined 3% to an average of 3.4 Bcf/d.
Gas-driven basins remain relatively flat on a W-o-W, averaging 43.8 Bcf/d. Within this segment, the Haynesville declined by 1% from 10.6 Bcf/d to 10.4 Bcf/d. The Marcellus+Utica increased from 32.5 to 32.3 Bcf/d.
Looking ahead, the Appalachia and Haynesville basins will be pivotal to monitor. With increased demand on the horizon, we expect increased production from these regions will be critical to maintaining balance between supply and demand.

Calendar: