Infrastructure – The Matterhorn Express Pipeline continues to ramp natural gas deliveries out of the Permian Basin, flowing over 1.6 Bcf/d recently to interstate systems at the Katy hub. Thanks to recently filed data, the market has a first view of the shippers backing the new Permian pipeline.
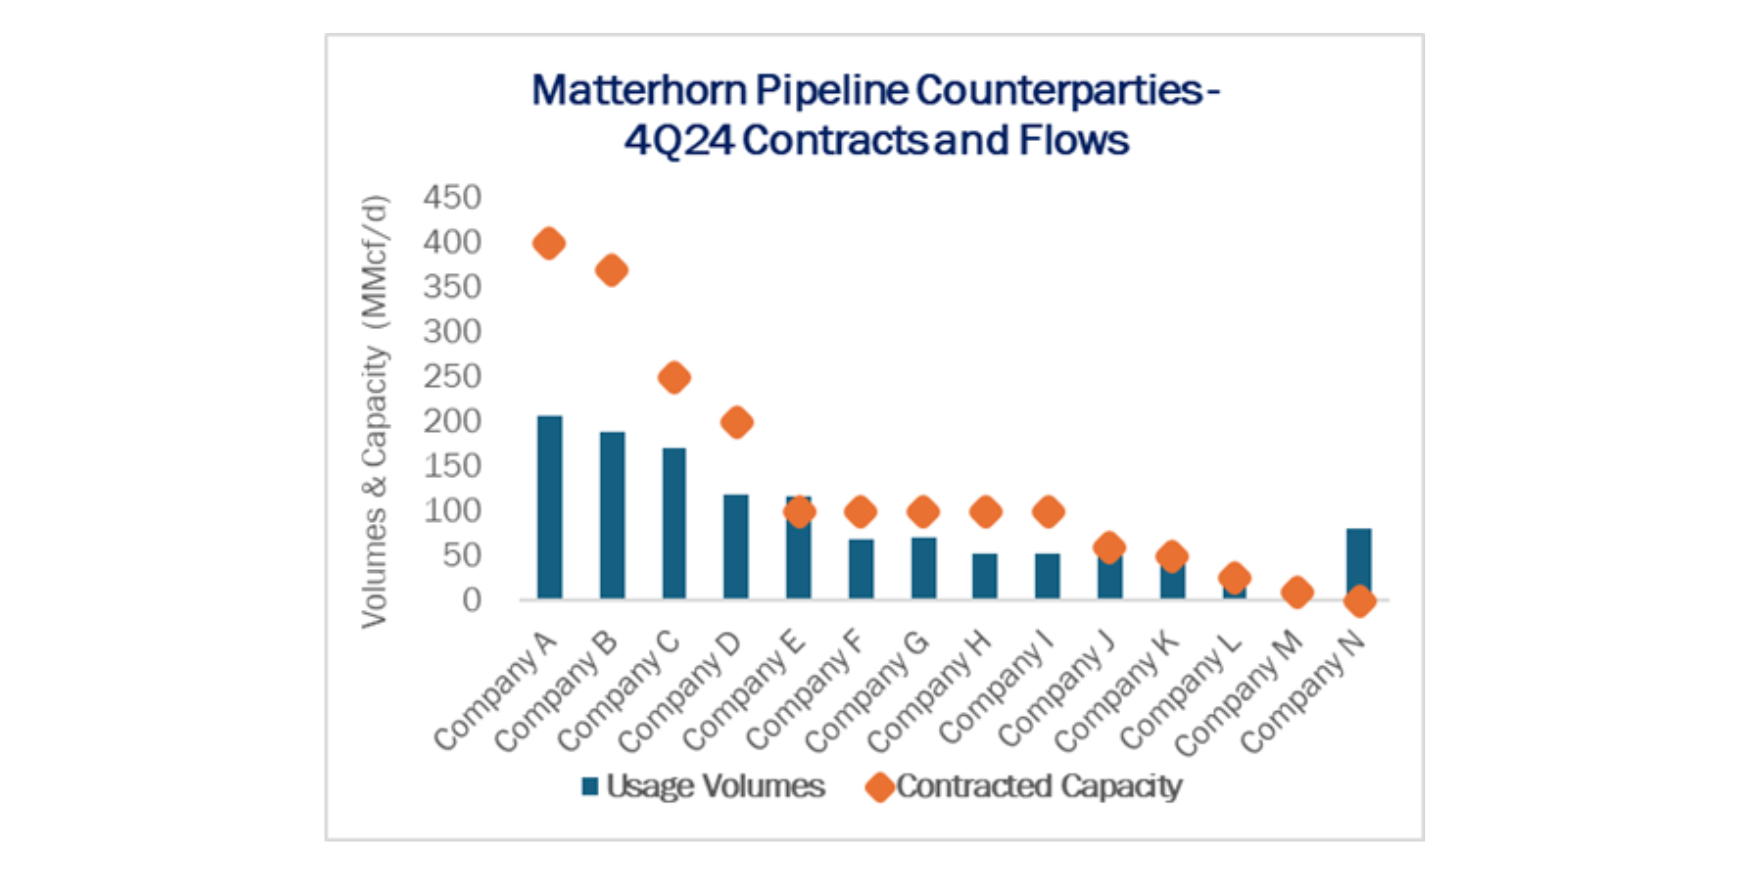
Matterhorn had a total of 1.865 Bcf/d of firm capacity under contract with 15 shippers in 4Q24, according to 549D intrastate pipeline data filed with the Federal Energy Regulatory Commission (FERC). Form 549D is a quarterly report that intrastate pipelines must file with FERC on transportation and contracting activity. Matterhorn began flowing gas on October 1, 2024, so the new filing reveals the first commercial data backing the WhiteWater-led project.

The contracts and usage for the Matterhorn shippers is shown in the figure. Shippers moved a total of 1.25 Bcf/d on Matterhorn in 4Q24, according to the 549D filing.
East Daley Analytics maintains cleaned and updated data sets for 549D and other FERC filings as part of the FERC Products package. Clients can access the 549D contract data for Matterhorn and other intrastate pipelines in the ‘FERC Data’ in the Energy Data Studio portal.
The 42-inch Matterhorn has been one of the most anticipated projects in energy markets. The line has at least temporarily debottlenecked gas egress out of the Permian Basin and created space for overall commodity supply growth.
Matterhorn volumes have continued to ramp in 2025, according to interstate pipeline samples. Matterhorn flows passed 1.6 Bcf/d in April, reaching a daily peak of 1.79 Bcf/d on April 11 (see figure). Deliveries to interstate systems in April averaged 1.67 Bcf/d, a new high.

Williams’ (WMB) Transcontinental Gas Pipe Line and Enbridge’s (ENB)the Texas Eastern system have both received more gas recently from Matterhorn, pacing the new highs. Matterhorn also connects to several intrastate systems near Katy where visibility is limited, so historical volumes are likely higher than our figure shows.
Reach out to East Daley to learn more about the Form 549D and other FERC data in the FERC Products package.
Infrastructure – Fears of a broader trade conflict hang over energy markets as the Trump administration considers additional tariffs on trade partners. How would a trade war affect US LNG exports? So far, China is the only nation to put tariffs on US cargoes, and we doubt buyers in Europe will follow suit. Nevertheless, East Daley sees consequences from the Trump administration’s fight over trade policy.
Beijing in February placed a 15% tariff on US LNG imports during the initial volleys with the administration over trade. Last Friday (April 11), China slapped a retaliatory 125% tariff on all US goods after President Trump raised levies on Chinese products to 145% earlier in the week.

The 15% tariff reportedly has forced Chinese buyers to turn away numerous US LNG cargos since the policy went into effect. However, LNG exports to China were already low following Russia’s invasion of Ukraine in early 2022, which saw US cargos diverted from Asia to European allies.
The US in 2024 exported 213 Bcf of LNG to China, according to Energy Information Administration (EIA) data. While a 25% increase from 2023, exports were still ~47% below 2021 levels. As a result, the Chinese tariffs implemented in February have had limited impact on US liquefiers. However, China isn’t the only nation considering retaliatory tariffs in the wake of the Trump administration’s tariff threats.
On April 9, President Trump announced that the reciprocal tariffs he had previously imposed on most US trade partners would be postponed for 90 days, while keeping in place a 10% tariff on US imports. The administration claims to be negotiating bilateral trade deals with countries to stave off the future tariffs. Some nations have expressed interest in negotiating with the White House, but the European Union has been weighing how to respond.
If European nations implemented across-the-board tariffs, it would have significant impacts on US LNG shipments. However, we see a tax on foreign energy as unlikely. As part of the ongoing Russia-Ukraine war, gas shipments from Russia through Ukraine have ended, forcing Europe to rely on LNG shipments to restock storage. From 2022 through 2024, US LNG exports to Europe averaged 2,613 Bcf per year, up 114% from the 1,218 Bcf received in 2021 (see figure from EIA data).
The EU’s increased reliance on US LNG would likely necessitate energy carveouts in any retaliatory tariffs. While this helps minimize the impact on liquefiers, deliveries to Europe only accounted for 53% of US exports in 2024. Depending how other nations react, the US LNG industry could see additional tariffs.
The real risk is to the long-term outlook. Liquefaction projects are expensive, and uncertainty over costs could stall negotiations between developers and potential LNG buyers. Contractors may also want to revisit prior estimates to build facilities, creating further delays for emerging projects. See EDA’s Macro Supply & Demand Report for more detail. In an optimistic scenario, the Trump administration will use its leverage to promote LNG exports and secure agreements for new projects. But otherwise, we anticipate commercial delays that will slow growth post-2030.
Storage – Traders and analysts expect the Energy Information Administration (EIA) to report a 100 Bcf injection for the week ending May 2. A 100 Bcf injection would be 21 Bcf greater than the 5-year average and would expand the surplus to 26 Bcf. The storage deficit to last year would fall by 19 Bcf to 416 Bcf.
The market is bracing for a second triple-digit injection in a row for the nascent 2025 injection season. The next three surveys (through the week ending May 23) could extend this streak to five straight report weeks, adding roughly 75 Bcf to the 5-year average surplus.

By comparison, the 2024 injection season (April-October) saw zero triple-digit injections in the EIA survey (coming close the week ending May 31 at 96 Bcf). The 2023 injection season saw just two 100+ Bcf surveys, for the last week of May and first week of June. The last injection season with more than five triple-digit injection weeks was in 2022, with seven. The most triple-digit injection weeks occurred in the 2014 and 2019 injection seasons, with
2014 being the coldest meteorological summer in the past 10 years.
The May prompt month seems to have mostly shrugged off early triple-digit injection news, gaining about $0.50 over the past week as a more bullish weather pattern emerges over the next 10 days.
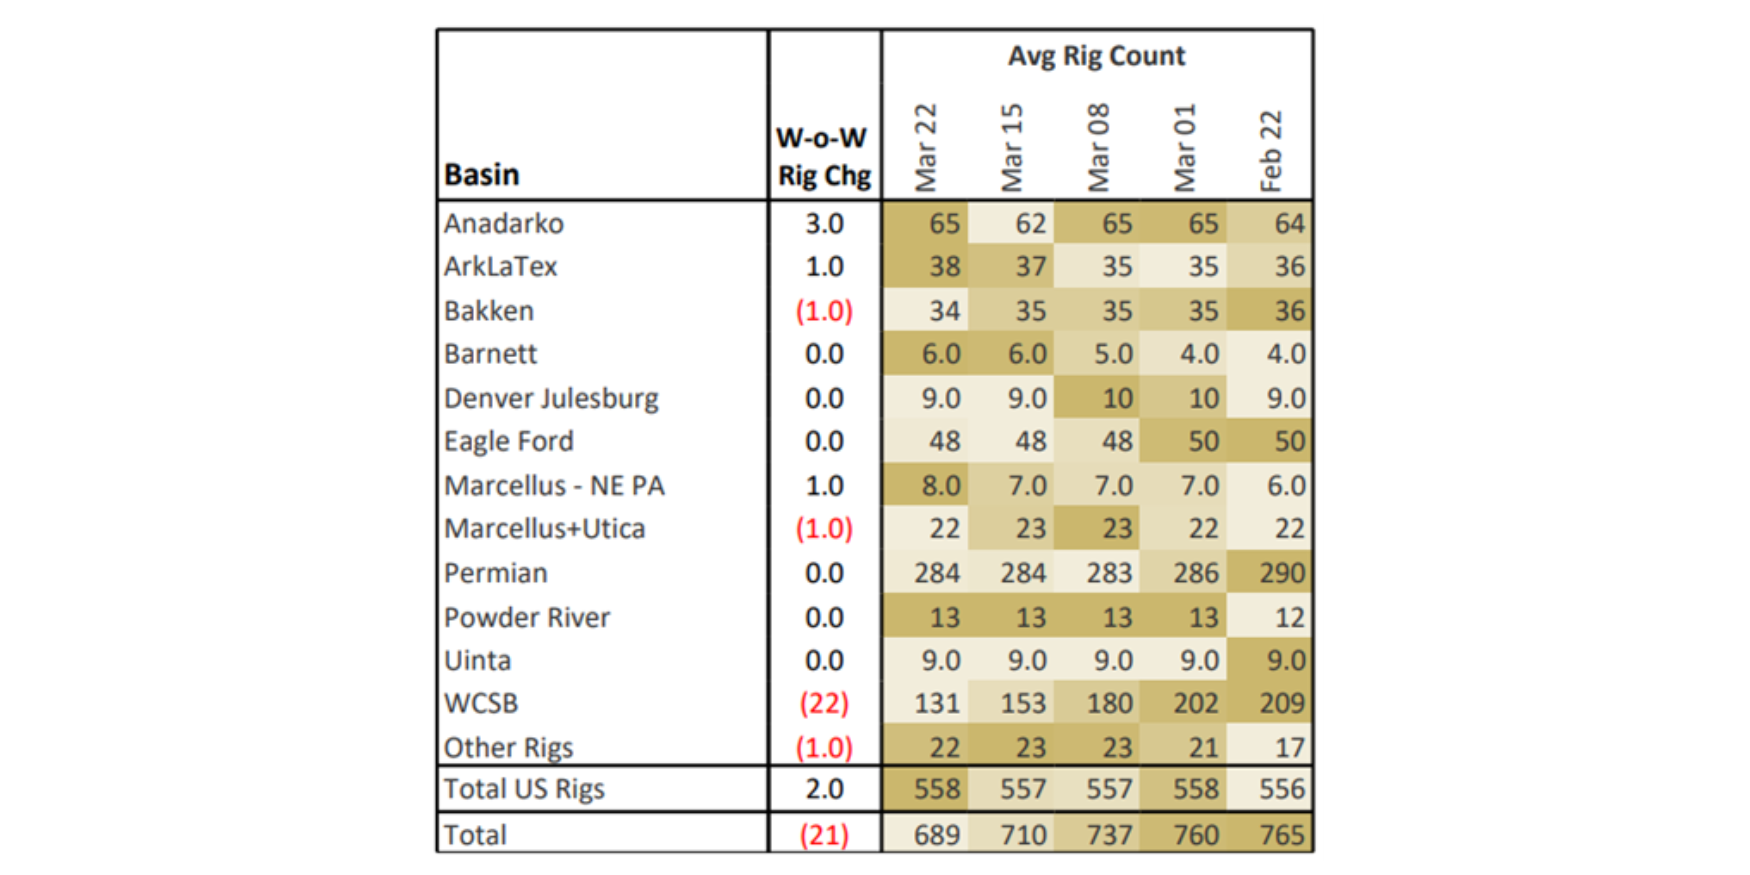
Rigs – The US rig count decreased by 14 for the April 26 week, standing at 558. The Permian (-6), Marcellus+Utica (-2), Anadarko (-2), DJ (-1), Uinta (-1) and Eagle Ford (-1) lost rigs while the ArkLaTex added a rig on the week.
On the midstream side, ONEOK (OKE) is down 3 rigs net with losses on its Bakken and Anadarko systems. Western Midstream (WES) is down 2 rigs total with losses on its Permian, Powder River and Uinta systems.

East Daley’s weekly Rig Activity Tracker monitors rig activity by basin and by gathering and processing (G&P) system to better understand midstream impacts. We allocate rigs and monitor flows through 150+ public and privately owned G&P systems in every North American basin. Reach out for more information on the Rig Activity Tracker.
The Daley Note
Subscribe to East Daley’s The Daley Note (TDN) for midstream insights delivered daily to your inbox. The Daley Note covers news, commodity prices, security prices, and EDA research likely to affect markets in the short term.