


Executive Summary: Infrastructure: US NGL infrastructure has quietly transitioned from tight to overbuilt. Rigs: The total US rig count decreased by 12 during the week of May 11 to 531. Liquids-driven basins decreased by 14 W-o-W from 439 to 425. Flows: For the week ending May 25, US natural gas volumes averaged 69.4 Bcf/d in pipeline samples, marking a W-o-W decrease from 70.3 Bcf/d the previous week.
Infrastructure:
US NGL infrastructure has quietly transitioned from tight to overbuilt. While LPG production continues to grow, the pace has moderated significantly following ‘Liberation Day’ and a softer WTI price environment.
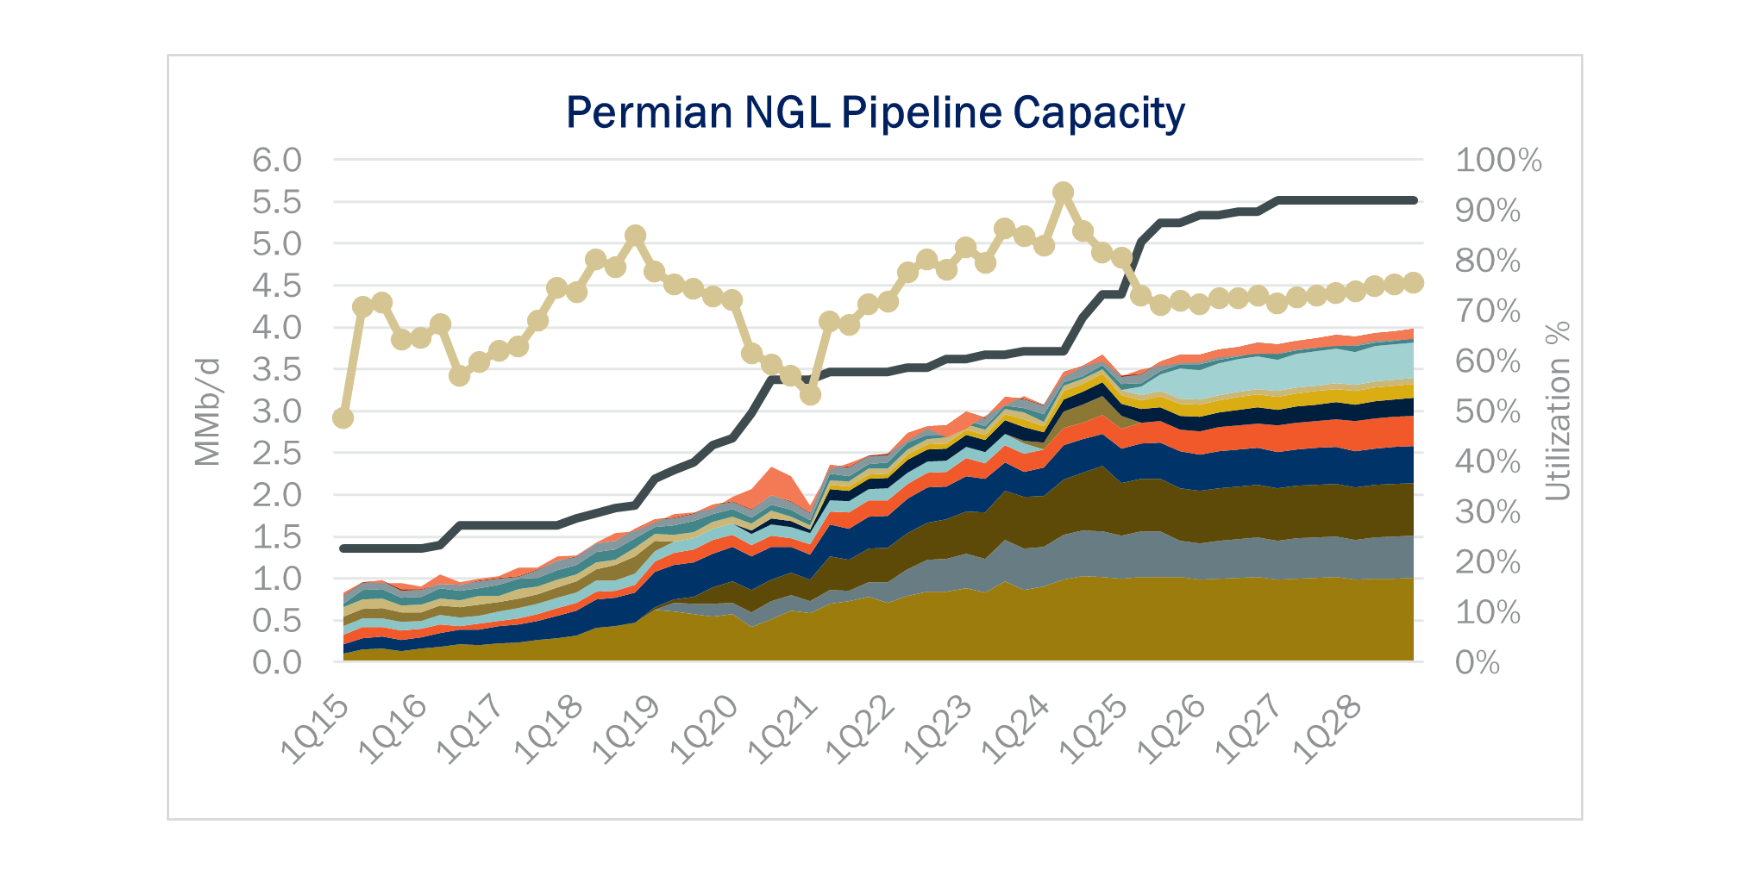
In the NGL Hub Model, Permian takeaway capacity, once a constraint, now exceeds demand by a wide margin, with total pipeline capacity nearing 5.5 MMb/d and utilization sliding back below 80%. This mirrors the dynamics seen in 2020-21, when too much pipe chased too few barrels during the downturn and led to downward pressure on transportation rates. It’s a scenario that is poised to return and persist through the end of the decade.

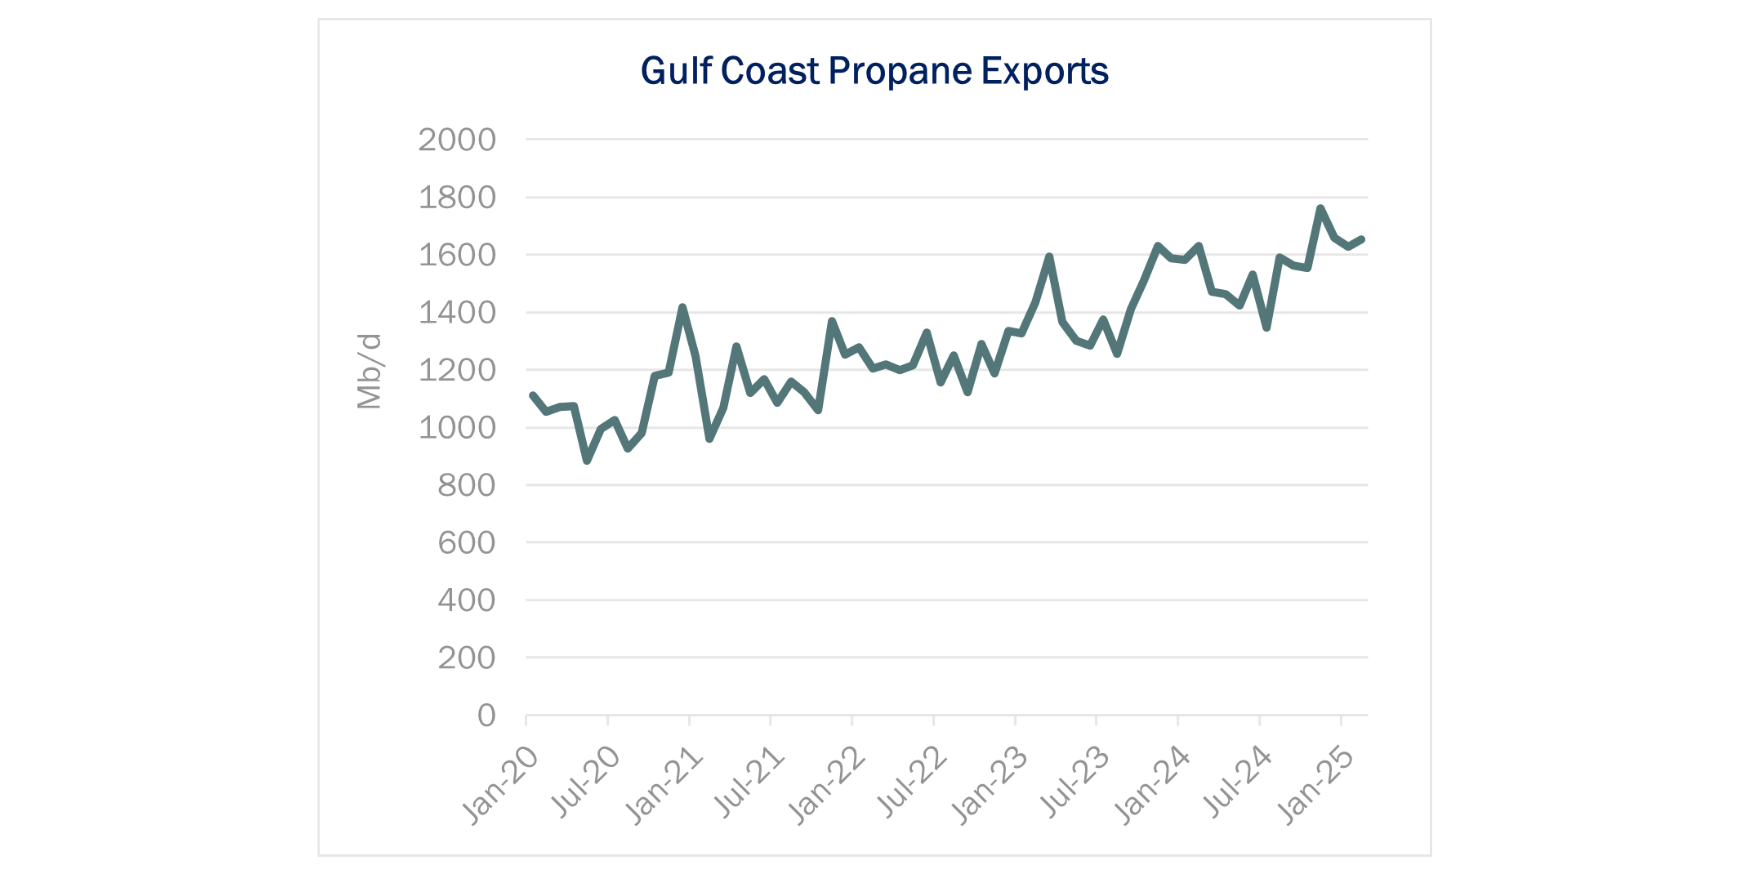
At the same time, export capacity along the Gulf Coast has rapidly expanded and will exceed 3.4 MMb/d by 2028. With major players like Enterprise (EPD), Energy Transfer (ET) and Targa Resources (TRGP) bringing new dock and refrigeration capabilities online, PADD 3 LPG export capacity has grown from constrained to a surplus. Utilization is flattening even as global demand rises, underscoring a structurally overbuilt system.
In this environment, the path to margin protection lies in full-chain integration. Operators who control the barrel from wellhead to water stand to capture the most value, potentially $11/bbl, by keeping volumes on their system. EPD, ET and TRGP are well-positioned here, while players like ONEOK (OKE) and MPLX, lacking full-chain integration, are increasingly exposed. The result will be a more competitive fight for barrels at the wellhead, where we expect to see more loss-leader behavior: midstreamers discounting tariffs upstream to secure volumes they can monetize downstream.

This overbuild will force a commercial reckoning across the sector. Tariff compression is likely to accelerate as contracts roll over and expose pipelines to lower rate resets, and asset utilization becomes a key battleground. As barrels become stickier and more valuable, East Daley expects to see a growing divide between integrated value chains and standalone transport assets. Contract structures may evolve to favor bundled services, and producers may lean toward counterparties who offer security of flow to docks. In short, infrastructure alone is no longer a differentiator: alignment across the chain is now the only way to win.
Rigs:
The total US rig count decreased by 12 during the week of May 11 to 531. Liquids-driven basins decreased by 14 W-o-W from 439 to 425.
- Permian-Midland (-7): Diamondback Energy, Oxy, Blackbeard Operating LLC, Highpeak Energy, SOGC LLC, Continental Resources, Texland Petroleum
- Permian-Delaware (-1): Oxy
- Anadarko (-2): Sanguine Gas Exploration, Packard Energy
- Bakken (-4): Continental Resources, Chord Energy, Koda Resources, ConocoPhillips

Flows:
For the week ending May 25, US natural gas volumes averaged 69.4 Bcf/d in pipeline samples, marking a W-o-W decrease from 70.3 Bcf/d the previous week.
Liquids-driven basins decreased 0.4 Bcf/d to 18.3 Bcf/d. The Permian Basin decreased 6.1% W-o-W to average 5.8 Bcf/d, with the Eagle Ford increasing 2.9% to 1.7 Bcf/d.
Gas-driven basins were relatively flat W-o-W, averaging 43.8 Bcf/d. The Haynesville decreased by 3.8% from 10.6 Bcf/d to 10.2 Bcf/d. The Marcellus+Utica increased 0.9% W-o-W.
Looking ahead, the Appalachia and Haynesville basins will be pivotal to monitor. With increased demand on the horizon, we expect increased production from these regions will be critical to maintain a balanced market.

Calendar:


-1.png)